In this article, we will show you how to create a dynamic bar chart in laravel. charts are used to represent data in graphics view, for creation of dynamic bar chart example you need to create a route, controller, blade file and database, So, if you will follow tutorial step by step then definitely you will get output.
So. let's see the dynamic bar chart in laravel and the dynamic bar chart example.
Step 2: Add migration and route
Step 3: Add Controller and model
Step 4: Create a blade file
Type the following command in the terminal.
composer create-project --prefer-dist laravel/laravel barchartWe need dynamic data for the bar chart example. So first, we have to create migration for the "product" table using laravel PHP artisan command, So, the first type is the below command.
php artisan make:migration create_products_table --create=productsAfter running this command you will find the PHP file here location "database/migrations/" in this file you need to add the below code.
<?php

use Illuminate\Database\Migrations\Migration;
use Illuminate\Database\Schema\Blueprint;
use Illuminate\Support\Facades\Schema;

class CreateProductTable extends Migration
{
    /**
     * Run the migrations.
     *
     * @return void
     */
    public function up()
    {
        Schema::create('product', function (Blueprint $table) {
            $table->id();
            $table->string('name')->nullable();
            $table->integer('price')->nullable();
            $table->integer('year')->nullable();
            $table->string('product_type')->nullable();
            $table->timestamps();
        });
    }

    /**
     * Reverse the migrations.
     *
     * @return void
     */
    public function down()
    {
        Schema::dropIfExists('product');
    }
}
After this, we need to run this migration by following the command in our terminal.
php artisan migrateNow, Add route in Routes/web.php
Route::get('barchart', '[email protected]');After adding the route we need to create a new controller and model. So, type the below command to create a controller.
php artisan make:controller BarchartControllerphp artisan make:model ProductIn this step, we will add the below code in the App\Http\Controllers\BarchartController path.
<?php

namespace App\Http\Controllers;

use Illuminate\Http\Request;
use App\Product;

class BarchartController extends Controller
{
    public function barchart(Request $request)
    {
    	$fruit = Product::where('product_type','fruit')->get();
    	$veg = Product::where('product_type','vegitable')->get();
    	$grains = Product::where('product_type','grains')->get();
    	$fruit_count = count($fruit);
    	$veg_count = count($veg);
    	$grains_count = count($grains);

    	return view('barchart',compact('fruit_count','veg_count','grains_count'));
    }
}Now in this step, we are creating a barchart.blade.php file for view.
<!DOCTYPE html>
<html>
<head>
	<meta charset="utf-8">
	<meta http-equiv="X-UA-Compatible" content="IE=edge">
	<title>how to create dynamic barchart in laravel - websolutionstuff.com</title>
	<link rel="stylesheet" href="https://maxcdn.bootstrapcdn.com/bootstrap/3.3.7/css/bootstrap.min.css">
	<link href="{{asset('assets/css/components.min.css')}}" rel="stylesheet" type="text/css">
	<script type="text/javascript" src="{{asset('assets/js/jquery.min.js')}}"></script>
	<script type="text/javascript" src="{{asset('assets/js/bootstrap.bundle.min.js')}}"></script>
	<script type="text/javascript" src="{{asset('assets/js/echarts.min.js')}}"></script>

</head>
<body>
<div class="col-md-12">
	<h1 class="text-center">how to create dynamic barchart in laravel - websolutionstuff.com</h1>
    <div class="col-md-8 col-md-offset-2">
    	<div class="col-xl-6">
    		<div class="card">
    			<div class="card-body">
    				<div class="chart-container">
    					<div class="chart has-fixed-height" id="bars_basic"></div>
    				</div>
    			</div>
    		</div>
    	</div>
    </div>
</div>
</body>
</html>

<script type="text/javascript">
var bars_basic_element = document.getElementById('bars_basic');
if (bars_basic_element) {
    var bars_basic = echarts.init(bars_basic_element);
    bars_basic.setOption({
        color: ['#3398DB'],
        tooltip: {
            trigger: 'axis',
            axisPointer: {
                type: 'shadow'
            }
        },
        grid: {
            left: '3%',
            right: '4%',
            bottom: '3%',
            containLabel: true
        },
        xAxis: [
            {
                type: 'category',
                data: ['Fruit', 'Vegitable','Grains'],
                axisTick: {
                    alignWithLabel: true
                }
            }
        ],
        yAxis: [
            {
                type: 'value'
            }
        ],
        series: [
            {
                name: 'Total Products',
                type: 'bar',
                barWidth: '20%',
                data: [
                    {{$fruit_count}},
                    {{$veg_count}},
                    {{$grains_count}}
                ]
            }
        ]
    });
}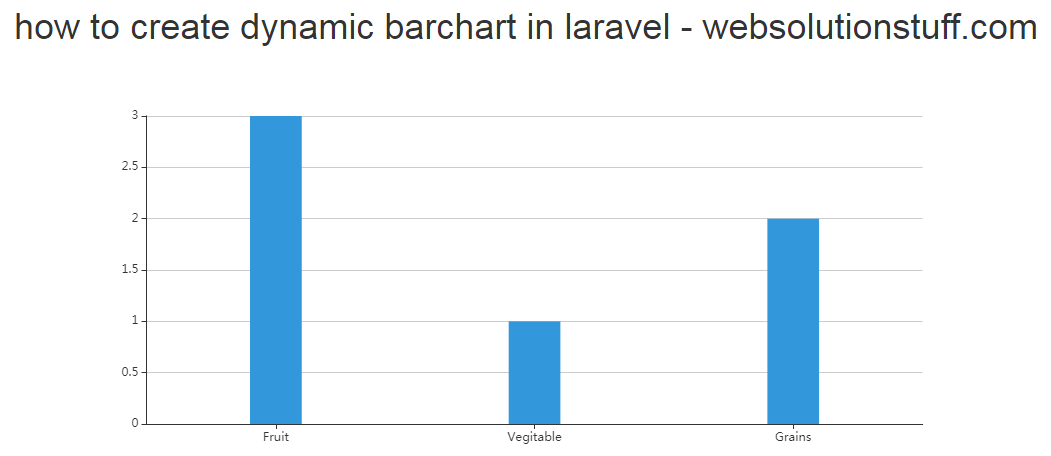
</script>So, We are done with our code and you can see the output as below screen print.
You might also like:
- Read Also: How To Create Dependent Dropdown In Laravel
- Read Also: How To Validate Max File Size Using Javascript
- Read Also: Laravel 8 Highcharts Example Tutorial
- Read Also: Laravel 8 Google Bar Chart Example