In this article, we will see how to create a line chart in laravel 9 using highcharts. A line chart is a graphical representation of an asset's historical price action that connects a series of data points with a continuous line. This is the most basic type of chart used in employment jobs and finance, and it typically only depicts a security's closing prices over time. You can learn laravel 9 highcharts line chart example.
The Highcharts library comes with all the tools you need to create reliable and secure data visualizations. Built on JavaScript and TypeScript. Highcharts is a javascript library, this library through we can use many charts like line charts, bar charts, pie charts, stock charts, etc. Also, Highcharts is an open-source chart library. So, we will learn highcharts example in laravel 9.
So, let's see how to add a line chart in laravel 9 using highcharts. Also, you can create a dynamic line chart in laravel 9 using highcharts
Step 1: Install Laravel 9 For Line Chart
Step 2: Add Route
Step 3: Create HighChartsController
Step 4: Create Blade File for Display Line Chart
Step 5: Add Highcharts Script
In this step, we will install laravel 9 using the following command.
composer create-project laravel/laravel line-chart-hightcharts-laravel-9In this step, we will add routes in the web.php file
use App\Http\Controllers\HighchartsController;

Route::get('line-chart/highchart', [HighchartsController::class, 'highChart']);Now, we will create HighchartsController.
app/Http/Controllers/HighchartsController
<?php

namespace App\Http\Controllers;

use Illuminate\Http\Request;

class HighchartsController extends Controller
{
    public function highChart()
    {
        // For a dynamic line chart you can pass "Data" from the controller.

        return view('index', compact('line-chart'));
    }
}In this step, we will create a line-chart.blade.php file also we will add CSS and jQuery and add the following code to that file.
resources/views/line-chart.blade.php
<html>
    <head>
        <style>
            .highcharts-figure,
            .highcharts-data-table table {
            min-width: 360px;
            max-width: 800px;
            margin: 1em auto;
            }

            .highcharts-data-table table {
            font-family: Verdana, sans-serif;
            border-collapse: collapse;
            border: 1px solid #ebebeb;
            margin: 10px auto;
            text-align: center;
            width: 100%;
            max-width: 500px;
            }

            .highcharts-data-table caption {
            padding: 1em 0;
            font-size: 1.2em;
            color: #555;
            }

            .highcharts-data-table th {
            font-weight: 600;
            padding: 0.5em;
            }

            .highcharts-data-table td,
            .highcharts-data-table th,
            .highcharts-data-table caption {
            padding: 0.5em;
            }

            .highcharts-data-table thead tr,
            .highcharts-data-table tr:nth-child(even) {
            background: #f8f8f8;
            }

            .highcharts-data-table tr:hover {
            background: #f1f7ff;
            }
        </style>
    </head>
    <title>How To Add Line Chart Highcharts In Laravel 9 - Websolutionstuff</title>
    <body>
        <figure class="highcharts-figure">
            <div id="container"></div>
        </figure>
    </body>
</html>Now, we will add highcharts.js and its function to display line charts. So, add the script in the <head> tag or at the bottom of the HTML tag.
<script src="https://code.highcharts.com/highcharts.js"></script>
<script src="https://code.highcharts.com/modules/series-label.js"></script>
<script src="https://code.highcharts.com/modules/exporting.js"></script>
<script src="https://code.highcharts.com/modules/export-data.js"></script>
<script src="https://code.highcharts.com/modules/accessibility.js"></script>
<script>
Highcharts.chart('container', {
title: {
text: 'How To Create Line Chart In Laravel 9 Using Highcharts - Websolutionstuff'
},
subtitle: {
text: 'Employment Growth by Job Category'
},
yAxis: {
title: {
text: 'Number of Employees'
}
},
xAxis: {
accessibility: {
rangeDescription: 'Range: 2010 to 2020'
}
},
legend: {
layout: 'vertical',
align: 'right',
verticalAlign: 'middle'
},
plotOptions: {
series: {
label: {
connectorAllowed: false
},
pointStart: 2010
}
},
series: [{
name: 'Installation & Developers',
data: [43934, 48656, 65165, 81827, 112143, 142383,
171533, 165174, 155157, 161454, 154610]
}, {
name: 'Manufacturing',
data: [24916, 37941, 29742, 29851, 32490, 30282,
38121, 36885, 33726, 34243, 31050]
}, {
name: 'Sales & Distribution',
data: [11744, 30000, 16005, 19771, 20185, 24377,
32147, 30912, 29243, 29213, 25663]
}, {
name: 'Operations & Maintenance',
data: [null, null, null, null, null, null, null,
null, 11164, 11218, 10077]
}, {
name: 'Other',
data: [21908, 5548, 8105, 11248, 8989, 11816, 18274,
17300, 13053, 11906, 10073]
}],
responsive: {
rules: [{
condition: {
maxWidth: 500
},
chartOptions: {
legend: {
layout: 'horizontal',
align: 'center',
verticalAlign: 'bottom'
}
}
}]
}
});
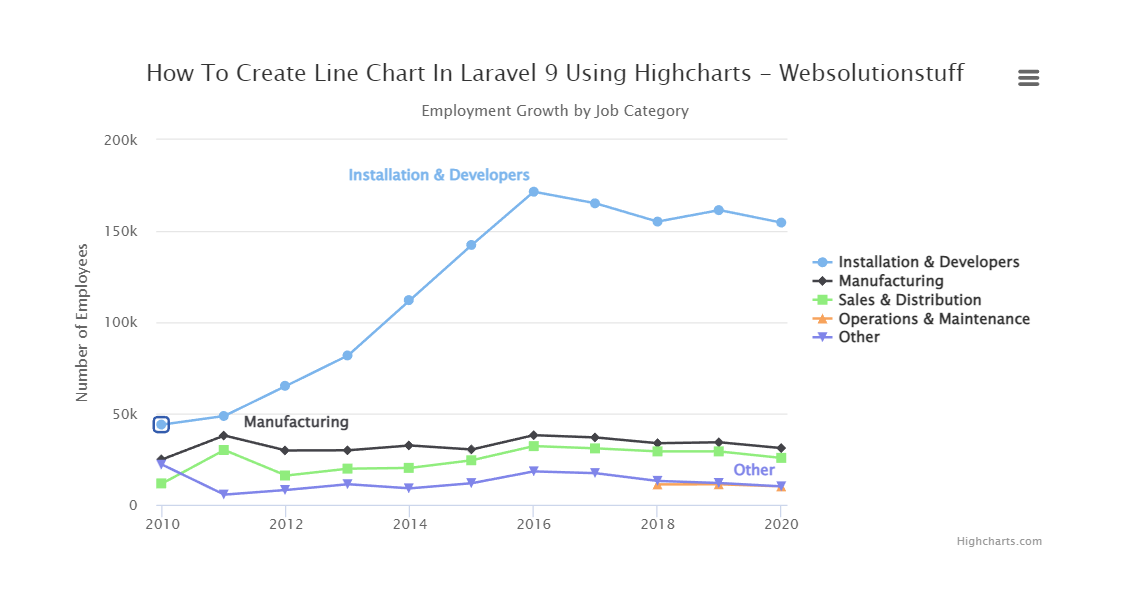
</script>Output:
You might also like:
- Read Also: Google Line Chart Example in Laravel 8
- Read Also: How To Create Dynamic Bar Chart In Laravel
- Read Also: How to Create Multi Language Website in Laravel
- Read Also: Laravel 9 User Roles and Permissions Without Package