In this article, we will see laravel 9 group column chart using highcharts. Here, we will learn how to create a dynamic group column chart in laravel 7, laravel 8, and laravel 9. A group column chart showing stacked columns with grouping, allowing specific series to be stacked on the same column.
A grouped bar chart also called clustered bar chart, multi-series bar chart, or extended version of the bar chart, plotting numeric values for levels of two categorical variables instead of one. You can install highcharts through npm and Bower. If you required npm or bower, prefer more npm or Bower respectively.
So, let's see how to create a dynamic group column chart in laravel 9 using highchart, and highchart group bar chart in laravel 7/8/9.
Step 1: Install Laravel 9
Step 2: Create HighChartsController
Step 3: Add Route
Step 4: Create Blade File for Display Group Column Chart
Step 5: Add Script of Group Column Chart
In this step, we will install the laravel 9 application using the following command.
composer create-project laravel/laravel laravel-9-group-column-hightchartsNow, we will create HighchartsController and add the highChart() function. So, add the below code to that file.
app/Http/Controllers/HighchartsController
<?php

namespace App\Http\Controllers;

use Illuminate\Http\Request;

class HighchartsController extends Controller
{
    public function groupHighChart()
    {

        return view('index', compact('group-column-chart'));

    }
}In this step, we will add routes in the web.php file. So, add the following code to that file.
routes/web.php
use App\Http\Controllers\HighchartsController;

Route::get('highchart/group-column-chart', [HighchartsController::class, 'groupHighChart']);In this step, we will create a group-column-chart.blade.php file. Also, we will add CSS and jQuery and add the following code to that file.
resources/views/group-column-chart.blade.php
<html>
    <head>
        <style>
            #container {
                height: 400px;
            }

            .highcharts-figure,
            .highcharts-data-table table {
                min-width: 310px;
                max-width: 800px;
                margin: 1em auto;
            }

            .highcharts-data-table table {
                font-family: Verdana, sans-serif;
                border-collapse: collapse;
                border: 1px solid #ebebeb;
                margin: 10px auto;
                text-align: center;
                width: 100%;
                max-width: 500px;
            }

            .highcharts-data-table caption {
                padding: 1em 0;
                font-size: 1.2em;
                color: #555;
            }

            .highcharts-data-table th {
                font-weight: 600;
                padding: 0.5em;
            }

            .highcharts-data-table td,
            .highcharts-data-table th,
            .highcharts-data-table caption {
                padding: 0.5em;
            }

            .highcharts-data-table thead tr,
            .highcharts-data-table tr:nth-child(even) {
                background: #f8f8f8;
            }

            .highcharts-data-table tr:hover {
                background: #f1f7ff;
            }
        </style>
    </head>
    <title>Laravel 9 Group Column Chart Using Highcharts - Websolutionstuff</title>
    <body>
        <div id="container"></div>
    </body>
</html>Now, we will use the Highcharts() function to display group columns or group bar charts. So, add the script in the <head> tag or at the bottom of the HTML tag.
<script src="https://code.highcharts.com/highcharts.js"></script>
<script src="https://code.highcharts.com/modules/exporting.js"></script>
<script src="https://code.highcharts.com/modules/export-data.js"></script>
<script src="https://code.highcharts.com/modules/accessibility.js"></script>
<script>
$(document).ready(function(){
Highcharts.chart('container', {
chart: {
type: 'column'
},
title: {
text: 'Laravel 9 Group Column Chart Using Highcharts - Websolutionstuff'
},
xAxis: {
categories: ['Gold', 'Silver', 'Bronze']
},
yAxis: {
allowDecimals: false,
min: 0,
title: {
text: 'Count medals'
}
},
tooltip: {
formatter: function () {
return '<b>' + this.x + '</b><br/>' +
this.series.name + ': ' + this.y;
}
},
series: [{
name: 'Norway',
data: [148, 133, 124],
stack: 'Europe'
}, {
name: 'Germany',
data: [102, 98, 65],
stack: 'Europe'
}, {
name: 'United States',
data: [113, 122, 95],
stack: 'North America'
}, {
name: 'Canada',
data: [77, 72, 80],
stack: 'North America'
}]
});
});
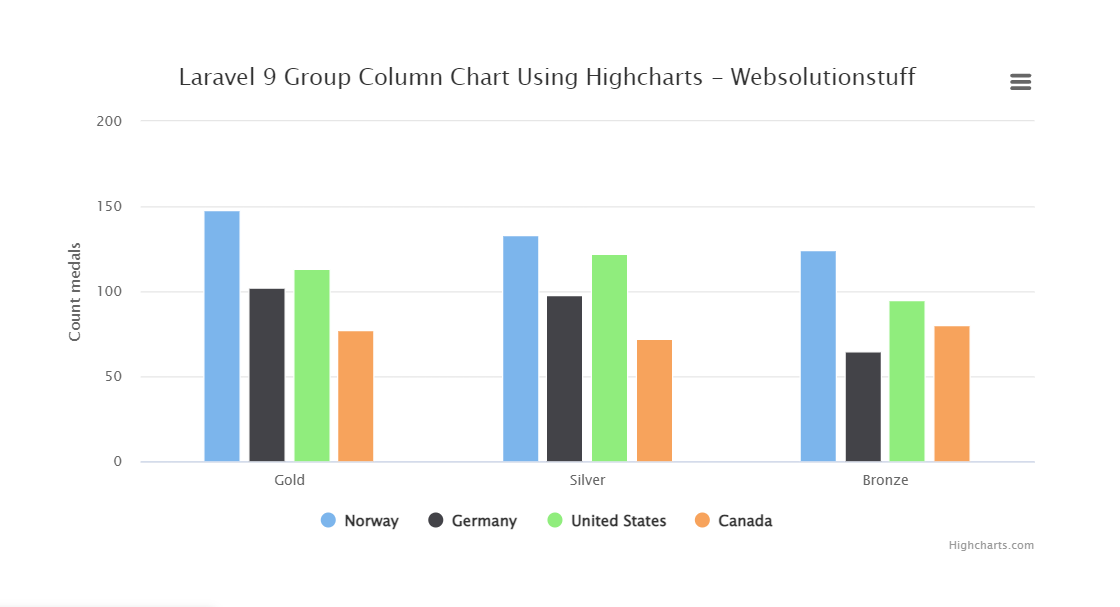
</script>Output:
You might also like:
- Read Also: Laravel 8 Google Bar Chart Example
- Read Also: How To Create Dynamic Bar Chart In Laravel
- Read Also: How To Create Dynamic Pie Chart In Laravel 9
- Read Also: How To Create Line Chart In Laravel 9 Using Highcharts