This article will show the laravel 8 google pie chart example. Google charts use to visualize data on your website. Here, we will see a pie chart example in laravel.
A pie chart is a circular statistical graphic, which is divided into slices to illustrate numerical proportions. Here we will see how to use google pie chart in laravel,
Here I have added a few steps of a dynamic google pie chart In laravel 8.
Step 1: Install Laravel
Step 2: Create a Migration
Step 3: Add Route
Step 4: Create Controller and Model
Step 5: Create Blade File
Install a new project in your laravel application for laravel 8 google pie chart example.
composer create-project --prefer-dist laravel/laravel google_piechartWe are getting dynamic data for the piechart example. So first, we need to create a migration for the "product" table using the laravel php artisan command. So, first type the below command for:
php artisan make:migration create_products_table --create=productsAfter running this command you will find php file in this location "database/migrations/" in this file you need to add the below code for the google pie chart In laravel 8.
<?php

use Illuminate\Database\Migrations\Migration;
use Illuminate\Database\Schema\Blueprint;
use Illuminate\Support\Facades\Schema;

class CreateProductsTable extends Migration
{
    public function up()
    {
        Schema::create('products', function (Blueprint $table) {
            $table->id();
            $table->string('name')->nullable();
            $table->integer('price')->nullable();
            $table->integer('year')->nullable();
            $table->string('product_type')->nullable();
            $table->timestamps();
        });
    }
    public function down()
    {
        Schema::dropIfExists('products');
    }
}
after this we need to run this migration by following the command in our terminal:
php artisan migrateAnd after migration, you need to add some records as per the below screen print.
Now add a route in Routes/web.php
Route::get('piechart', '[email protected]');After adding the route we need to create a new controller and model for the google piechart example. So, type the below command in your terminal to create a controller.
php artisan make:controller PiechartControllerphp artisan make:model ProductNow add the below code in your PiechartController.
<?php

namespace App\Http\Controllers;

use Illuminate\Http\Request;
use App\Product;

class PiechartController extends Controller
{
    public function piechart(Request $request)
    {
    	$phone_count_18 = Product::where('product_type','phone')->where('year','2018')->get()->count();
    	$phone_count_19 = Product::where('product_type','phone')->where('year','2019')->get()->count();
    	$phone_count_20 = Product::where('product_type','phone')->where('year','2020')->get()->count();

    	$laptop_count_18 = Product::where('product_type','laptop')->where('year','2018')->get()->count();
    	$laptop_count_19 = Product::where('product_type','laptop')->where('year','2019')->get()->count();
    	$laptop_count_20 = Product::where('product_type','laptop')->where('year','2020')->get()->count();

    	$tablet_count_18 = Product::where('product_type','tablet')->where('year','2018')->get()->count();
    	$tablet_count_19 = Product::where('product_type','tablet')->where('year','2019')->get()->count();
    	$tablet_count_20 = Product::where('product_type','tablet')->where('year','2020')->get()->count();

    	return view('piechart',compact('phone_count_18','phone_count_19','phone_count_20','laptop_count_18','laptop_count_19','laptop_count_20','tablet_count_18','tablet_count_19','tablet_count_20'));
    }
}In last we are creating a blade file to view the output of the pie chart example in laravel. So, copy the below code in your piechart.blade.php file.
<html>
<head>
<title>Laravel 8 Google Pie Chart Example - websolutionstuff.com</title>
<script type="text/javascript" src="https://www.gstatic.com/charts/loader.js"></script>
</head>
<body>
<h2 style="margin:50px 0px 0px 0px;text-align: center;">Laravel 8 Google Pie Chart Tutorial - websolutionstuff.com</h2>
<div id="piechart" style="width: 900px; height: 500px; margin-left: 235px"></div>
<script type="text/javascript">
var phone_count_18 = <?php echo $phone_count_18; ?>;
var phone_count_19 = <?php echo $phone_count_19; ?>;
var phone_count_20 = <?php echo $phone_count_20; ?>;
var laptop_count_18 = <?php echo $laptop_count_18; ?>;
var laptop_count_19 = <?php echo $laptop_count_19; ?>;
var laptop_count_20 = <?php echo $laptop_count_20; ?>;
var tablet_count_18 = <?php echo $tablet_count_18; ?>;
var tablet_count_19 = <?php echo $tablet_count_19; ?>;
var tablet_count_20 = <?php echo $tablet_count_20; ?>;
google.charts.load('current', {'packages':['corechart']});
google.charts.setOnLoadCallback(drawChart);
function drawChart() {
var data = google.visualization.arrayToDataTable([
['Year', 'Phone', 'Laptop', 'Tablet'],
['2018', phone_count_18, laptop_count_18, tablet_count_18],
['2019', phone_count_19, laptop_count_19, tablet_count_19],
['2020', phone_count_20, laptop_count_20, tablet_count_20]
]);
var options = {
curveType: 'function',
legend: { position: 'bottom' }
};
var chart = new google.visualization.PieChart(document.getElementById('piechart'));
chart.draw(data, options);
}
</script>
</body>
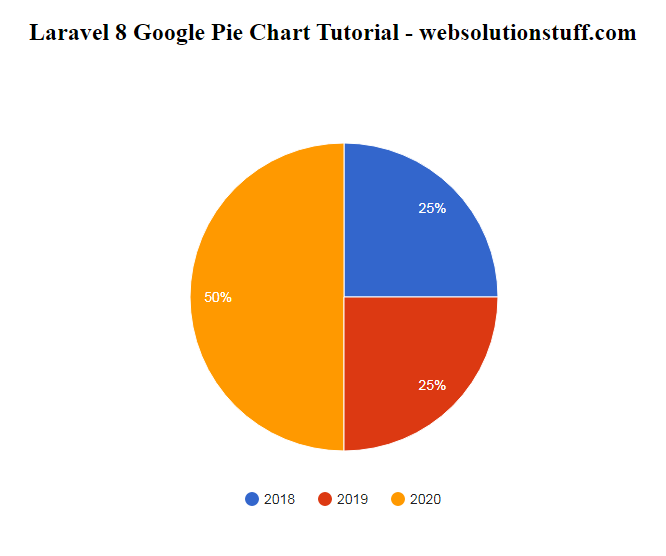
</html>Output:
You might also like:
- Read Also: Google Autocomplete Address In Laravel 9
- Read Also: How To Implement Google Bar Chart In Vue Js
- Read Also: Laravel 8 Autocomplete Search from Database
- Read Also: How To Use Google Recaptcha V2 In Laravel 9