In this post, we will see how to create a dynamic line chart in laravel. A dynamic line chart or line plot or line graph or curve chart is a type of chart that displays information as a series of data points called 'markers' connected by straight line segments. It is a basic type of chart common in many fields. The line chart is used to display online shopping, online sales, and online users count.
For the creation of a dynamic line chart example you need to create a route, controller, blade file, and database, So if you will follow my tutorial step by step then definitely you will get the output for the charts line.
Type the following command in the terminal to install a new project in laravel for chart js.
composer create-project --prefer-dist laravel/laravel linechartWe are getting dynamic data for the chart using js. So first, we need to create migration for the "product" table using the laravel PHP artisan command. So, the first type below command:
php artisan make:migration create_products_table --create=productsAfter running this command you will find a php file in this location "database/migrations/" in this file you need to add the below code.
<?php

use Illuminate\Database\Migrations\Migration;
use Illuminate\Database\Schema\Blueprint;
use Illuminate\Support\Facades\Schema;

class CreateProductsTable extends Migration
{
    public function up()
    {
        Schema::create('products', function (Blueprint $table) {
            $table->id();
            $table->string('name')->nullable();
            $table->integer('price')->nullable();
            $table->integer('year')->nullable();
            $table->string('product_type')->nullable();
            $table->timestamps();
        });
    }
    public function down()
    {
        Schema::dropIfExists('products');
    }
}
after this we need to run this migration by the following command in our terminal:
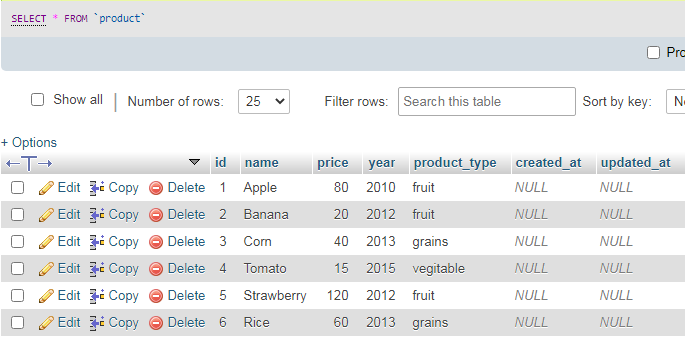
php artisan migrateAnd after migration, you need to add some records as per the below screen print.
Now add a route in Routes/web.php
Route::get('linechart', '[email protected]');After adding the route we need to create a new controller and model for the line chart example. So, type the below command in your terminal to create a controller.
php artisan make:controller LinechartControllerphp artisan make:model ProductNow add the below code in your linechartcontroller.
<?php

namespace App\Http\Controllers;

use Illuminate\Http\Request;
use App\Product;

class LinechartController extends Controller
{
    public function linechart(Request $request)
    {
    	$phone_18 = Product::where('product_type','phone')->where('year','2018')->get();
    	$phone_19 = Product::where('product_type','phone')->where('year','2019')->get();
    	$phone_20 = Product::where('product_type','phone')->where('year','2020')->get();

    	$laptop_18 = Product::where('product_type','laptop')->where('year','2018')->get();
    	$laptop_19 = Product::where('product_type','laptop')->where('year','2019')->get();
    	$laptop_20 = Product::where('product_type','laptop')->where('year','2020')->get();

    	$tablet_18 = Product::where('product_type','tablet')->where('year','2018')->get();
    	$tablet_19 = Product::where('product_type','tablet')->where('year','2019')->get();
    	$tablet_20 = Product::where('product_type','tablet')->where('year','2020')->get();

    	$phone_count_18 = count($phone_18);
    	$phone_count_19 = count($phone_19);
    	$phone_count_20 = count($phone_20);

    	$laptop_count_18 = count($laptop_18);
    	$laptop_count_19 = count($laptop_19);
    	$laptop_count_20 = count($laptop_20);

    	$tablet_count_18 = count($tablet_18);
    	$tablet_count_19 = count($tablet_19);
    	$tablet_count_20 = count($tablet_20);

    	return view('linechart',compact('phone_count_18','phone_count_19','phone_count_20','laptop_count_18','laptop_count_19','laptop_count_20','tablet_count_18','tablet_count_19','tablet_count_20'));
    }
}In last we are creating a blade file for viewing the output of the line chart. So, copy the below code in your linechart.blade.php file.
<!DOCTYPE html>
<html>
<head>
	<meta charset="utf-8">
	<meta http-equiv="X-UA-Compatible" content="IE=edge">
	<title>how to create dynamic linechart in laravel - websolutionstuff.com</title>
	<link rel="stylesheet" href="https://maxcdn.bootstrapcdn.com/bootstrap/3.3.7/css/bootstrap.min.css">
	<link href="{{asset('assets/css/components.min.css')}}" rel="stylesheet" type="text/css">
	<script type="text/javascript" src="{{asset('assets/js/jquery.min.js')}}"></script>
	<script type="text/javascript" src="{{asset('assets/js/bootstrap.bundle.min.js')}}"></script>
	<script type="text/javascript" src="{{asset('assets/js/echarts.min.js')}}"></script>

</head>
<body>
<div class="col-md-12">
	<h1 class="text-center">how to create dynamic linechart in laravel - websolutionstuff.com</h1>
    <div class="col-md-8 col-md-offset-2">
    	<div class="col-xl-6">
    		<div class="card">
    			<div class="card-body">
    				<div class="chart-container">
    					<div class="chart has-fixed-height" id="line_stacked"></div>
    				</div>
    			</div>
    		</div>
    	</div>
    </div>
</div>
</body>
</html>

<script type="text/javascript">
var line_stacked_element = document.getElementById('line_stacked');
if (line_stacked_element) {
    var line_stacked = echarts.init(line_stacked_element);
    line_stacked.setOption({
        animationDuration: 750,
        grid: {
            left: 0,
            right: 20,
            top: 35,
            bottom: 0,
            containLabel: true
        },
        legend: {
            data: ['phone', 'laptop', 'tablet'],
            itemHeight: 8,
            itemGap: 20
        },

        // Add tooltip
        tooltip: {
            trigger: 'axis',
            backgroundColor: 'rgba(0,0,0,0.75)',
            padding: [10, 15],
            textStyle: {
                fontSize: 13,
                fontFamily: 'Roboto, sans-serif'
            }
        },

        xAxis: [{
            type: 'category',
            boundaryGap: false,
            data: [
                '2018', '2019', '2020'
            ],
            axisLabel: {
                color: '#333'
            },
            axisLine: {
                lineStyle: {
                    color: '#999'
                }
            },
            splitLine: {
                lineStyle: {
                    color: ['#eee']
                }
            }
        }],

        // Vertical axis
        yAxis: [{
            type: 'value',
            axisLabel: {
                color: '#333'
            },
            axisLine: {
                lineStyle: {
                    color: '#999'
                }
            },
            splitLine: {
                lineStyle: {
                    color: ['#eee']
                }
            },
            splitArea: {
                show: true,
                areaStyle: {
                    color: ['rgba(250,250,250,0.1)', 'rgba(0,0,0,0.01)']
                }
            }
        }],

        // Add series
        series: [
            {
                name: 'phone',
                type: 'line',
                stack: 'Total',
                smooth: true,
                symbolSize: 7,
                data: [{{$phone_count_18}},{{$phone_count_19}},{{$phone_count_20}}],
                itemStyle: {
                    normal: {
                        borderWidth: 2
                    }
                }
            },
            {
                name: 'laptop',
                type: 'line',
                stack: 'Total',
                smooth: true,
                symbolSize: 7,
                data: [{{$laptop_count_18}},{{$laptop_count_19}},{{$laptop_count_20}}],
                itemStyle: {
                    normal: {
                        borderWidth: 2
                    }
                }
            },
            {
                name: 'tablet',
                type: 'line',
                stack: 'Total',
                smooth: true,
                symbolSize: 7,
                data: [{{$tablet_count_18}},{{$tablet_count_19}},{{$tablet_count_20}}],
                itemStyle: {
                    normal: {
                        borderWidth: 2
                    }
                }
            }
        ]
    });
}
</script>After following all steps you will get output like the below screen print.
You might also like :
- Read Also: Node.js Express CRUD Example with MySQL
- Read Also: Google Line Chart Example in Laravel 8
- Read Also: How To Use Sweetalert2 In Laravel
- Read Also: Line Breaks In Laravel Blade