In this article, we will see how to create a dynamic line chart in laravel 9. A dynamic line chart or line plot or line graph or curve chart is a type of chart that displays information as a series of data points called 'markers' connected by straight line segments. It is a basic type of chart common in many fields.
So, let's see line chart example in laravel 9, line chart in laravel 9, dynamic line chart example in laravel 9, line chart in PHP, laravel 9 chart js tutorial.
For the creation of a dynamic line chart example, you need to create a route, controller, blade file, and database. So, if you follow the tutorial step by step then definitely you will get output.
Step 1 : Install Laravel 9 For Dynamic Line Chart
Step 2 : Create Migration Table
Step 3 : Add Route
Step 4 : Create Controller And Model
Step 5 : Add Code In Controller
Step 6 : Create Blade File
In this step, we will create the laravel 9 project using the below command.
composer create-project --prefer-dist laravel/laravel linechartAfter that, we are getting dynamic data for line chart example. So, first, we need to create migration for the "product" table using the below command.
php artisan make:migration create_products_table --create=productsAfter running this command you will find the PHP file on location "database/migrations/". And in this file add the below code.
<?php

use Illuminate\Database\Migrations\Migration;
use Illuminate\Database\Schema\Blueprint;
use Illuminate\Support\Facades\Schema;

class CreateProductsTable extends Migration
{
    public function up()
    {
        Schema::create('products', function (Blueprint $table) {
            $table->id();
            $table->string('name')->nullable();
            $table->integer('price')->nullable();
            $table->integer('year')->nullable();
            $table->string('product_type')->nullable();
            $table->timestamps();
        });
    }
    public function down()
    {
        Schema::dropIfExists('products');
    }
}
After these changes we need to run this migration by the following command in our terminal:
php artisan migrateNow, add a route in the routes/web.php file.
<?php

use Illuminate\Support\Facades\Route;
use App\Http\Controllers\LinechartController;

/*
|--------------------------------------------------------------------------
| Web Routes
|--------------------------------------------------------------------------
|
| Here is where you can register web routes for your application. These
| routes are loaded by the RouteServiceProvider within a group which
| contains the "web" middleware group. Now create something great!
|
*/

Route::get('/', function () {
    return view('welcome');
});

Route::get('line-chart', [LinechartController::class,'linechart']);After adding the route, we need to create a new controller and model for the line chart example. So, type the below command for creating a controller.
php artisan make:controller LinechartControllerphp artisan make:model ProductAdd below code in your app\Http\Controllers\LinechartController.php file.
<?php

namespace App\Http\Controllers;

use Illuminate\Http\Request;
use App\Product;

class LinechartController extends Controller
{
    public function linechart(Request $request)
    {
    	$phone_count_20 = Product::where('product_type','Phone')->where('year','2020')->get()->count();
    	$phone_count_21 = Product::where('product_type','Phone')->where('year','2021')->get()->count();
    	$phone_count_22 = Product::where('product_type','Phone')->where('year','2022')->get()->count();

    	$laptop_count_20 = Product::where('product_type','Laptop')->where('year','2020')->get()->count();
    	$laptop_count_21 = Product::where('product_type','Laptop')->where('year','2021')->get()->count();
    	$laptop_count_22 = Product::where('product_type','Laptop')->where('year','2022')->get()->count();

    	$desktop_count_20 = Product::where('product_type','Desktop')->where('year','2020')->get()->count();
    	$desktop_count_21 = Product::where('product_type','Desktop')->where('year','2021')->get()->count();
    	$desktop_count_22 = Product::where('product_type','Desktop')->where('year','2022')->get()->count();

    	return view('linechart',compact('phone_count_20','phone_count_21','phone_count_22','laptop_count_20','laptop_count_21','laptop_count_22','desktop_count_20','desktop_count_21','desktop_count_22'));
    }
}
In this step, we are creating a linechart.blade.php file for view.
<!DOCTYPE html>
<html>
<head>
	<meta charset="utf-8">
	<meta http-equiv="X-UA-Compatible" content="IE=edge">
	<title>How To Create Dynamic Line Chart In Laravel 9 - Websolutionstuff</title>
	<link rel="stylesheet" href="https://maxcdn.bootstrapcdn.com/bootstrap/3.3.7/css/bootstrap.min.css">
	<link href="{{asset('assets/css/components.min.css')}}" rel="stylesheet" type="text/css">
	<link href="{{asset('assets/css/components.min.css')}}" rel="stylesheet" type="text/css">
    <script src="https://cdnjs.cloudflare.com/ajax/libs/jquery/3.6.0/jquery.min.js" crossorigin="anonymous" referrerpolicy="no-referrer"></script>
    <script src="https://cdnjs.cloudflare.com/ajax/libs/echarts/5.3.1/echarts.min.js" crossorigin="anonymous" referrerpolicy="no-referrer"></script>
</head>
<body>
<div class="col-md-12">
	<h1 class="text-center">How To Create Dynamic Line Chart In Laravel 9 - Websolutionstuff</h1>
    <div class="col-md-8 col-md-offset-2">
    	<div class="col-xl-6">
    		<div class="card">
    			<div class="card-body">
    				<div class="chart-container">
    					<div class="chart has-fixed-height" id="line_stacked"></div>
    				</div>
    			</div>
    		</div>
    	</div>
    </div>
</div>
</body>
</html>

<script type="text/javascript">
var line_stacked_element = document.getElementById('line_stacked');
if (line_stacked_element) {
    var line_stacked = echarts.init(line_stacked_element);
    line_stacked.setOption({
        animationDuration: 750,
        grid: {
            left: 0,
            right: 20,
            top: 35,
            bottom: 0,
            containLabel: true
        },
        legend: {
            data: ['Laptop', 'Phone', 'Desktop'],
            itemHeight: 8,
            itemGap: 20
        },

        // Add tooltip
        tooltip: {
            trigger: 'axis',
            backgroundColor: 'rgba(0,0,0,0.75)',
            padding: [10, 15],
            textStyle: {
                fontSize: 13,
                fontFamily: 'Roboto, sans-serif'
            }
        },

        xAxis: [{
            type: 'category',
            boundaryGap: false,
            data: [
                '2020', '2021', '2022'
            ],
            axisLabel: {
                color: '#333'
            },
            axisLine: {
                lineStyle: {
                    color: '#999'
                }
            },
            splitLine: {
                lineStyle: {
                    color: ['#eee']
                }
            }
        }],

        // Vertical axis
        yAxis: [{
            type: 'value',
            axisLabel: {
                color: '#333'
            },
            axisLine: {
                lineStyle: {
                    color: '#999'
                }
            },
            splitLine: {
                lineStyle: {
                    color: ['#eee']
                }
            },
            splitArea: {
                show: true,
                areaStyle: {
                    color: ['rgba(250,250,250,0.1)', 'rgba(0,0,0,0.01)']
                }
            }
        }],

        // Add series
        series: [
            {
                name: 'Laptop',
                type: 'line',
                stack: 'Total',
                smooth: true,
                symbolSize: 7,
                data: [{{$laptop_count_20}},{{$laptop_count_21}},{{$laptop_count_22}}],
                itemStyle: {
                    normal: {
                        borderWidth: 2
                    }
                }
            },
            {
                name: 'Phone',
                type: 'line',
                stack: 'Total',
                smooth: true,
                symbolSize: 7,
                data: [{{$phone_count_20}},{{$phone_count_21}},{{$phone_count_22}}],
                itemStyle: {
                    normal: {
                        borderWidth: 2
                    }
                }
            },
            {
                name: 'Desktop',
                type: 'line',
                stack: 'Total',
                smooth: true,
                symbolSize: 7,
                data: [{{$desktop_count_20}},{{$desktop_count_21}},{{$desktop_count_22}}],
                itemStyle: {
                    normal: {
                        borderWidth: 2
                    }
                }
            }
        ]
    });
}
</script>
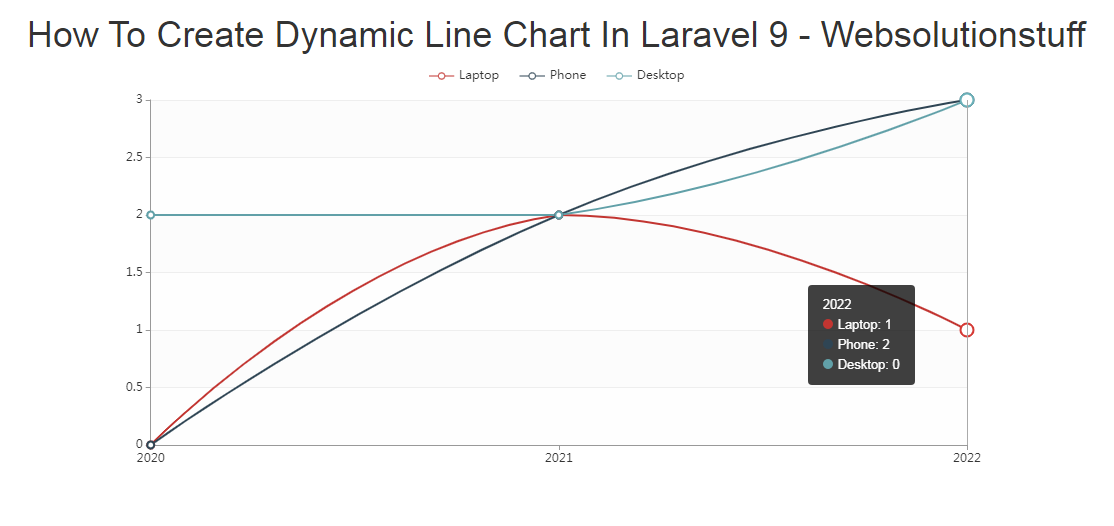
Output :
You might also like :
- Read Also: Laravel 8 Inner Join Query Example
- Read Also: Laravel 9 Cron Job Task Scheduling Tutorial
- Read Also: Laravel 9 Autocomplete Search from Database
- Read Also: Laravel 9 REST API With Passport Authentication