Hello guys,
In this tutorial we will see laravel 8 highcharts example tutorial. you will learn how to implement a highcharts in laravel 8 using highchart js.using highcharts you can create interactive charts easily for your web projects. so, now we will see basic line chart using highcharts in laravel 8.
Highcharts is a javascript library, this library through we can use many charts like line charts, bar charts, pie charts, stock charts etc. Highcharts is a open source chart library.
For more information about highcharts : HighCharts Official Site.
A chart is a graphical representation for data visualization, in which "the data is represented by symbols, such as bars in a bar chart, lines in a line chart, or slices in a pie chart". so it's helpful in easy to understand.
So, let's start to implement Laravel 8 Highcharts Example Tutorial.
In this step add routes in web.php file
use App\Http\Controllers\UserController;

Route::get('highchart', [UserController::class, 'highChart']);Now in this step create UserController in App\Http\Controllers path.
<?php

namespace App\Http\Controllers;

use Illuminate\Http\Request;
use App\User;

class UserController extends Controller
{
    public function highChart()
    {
        $users = User::select(\DB::raw("COUNT(*) as count"))
                    ->whereYear('created_at', date('Y'))
                    ->groupBy(\DB::raw("Month(created_at)"))
                    ->pluck('count');
        return view('index', compact('users'));
    }
}In step 3 create blade file for display Highcharts in frontside so create index file in below path. and copy and paste below code in your file.
resources/views/index.blade.php
<!DOCTYPE html>
<html>
<head>
<title>Laravel 8 Highcharts Example - websolutionstuff.com</title>
<link rel="stylesheet" href="https://maxcdn.bootstrapcdn.com/bootstrap/3.3.7/css/bootstrap.min.css">
</head>
<body style="border:1px solid red; margin:20px;">
<h1 class="text-center">Laravel 8 Highcharts Example - websolutionstuff.com</h1>
<div id="container"></div>
</body>
<script src="https://code.highcharts.com/highcharts.js"></script>
<script type="text/javascript">
var users = <?php echo json_encode($users) ?>;
Highcharts.chart('container', {
title: {
text: 'New User Records - 2021'
},
subtitle: {
text: 'Source: websolutionstuff.com'
},
xAxis: {
categories: ['Jan', 'Feb', 'Mar', 'Apr', 'May', 'Jun', 'Jul', 'Aug', 'Sep', 'Oct', 'Nov', 'Dec']
},
yAxis: {
title: {
text: 'Number of Users'
}
},
legend: {
layout: 'horizontal',
align: 'center',
verticalAlign: 'bottom'
},
plotOptions: {
series: {
allowPointSelect: true
}
},
series: [{
name: 'New Users',
data: users
}],
responsive: {
rules: [{
condition: {
maxWidth: 500
},
chartOptions: {
legend: {
layout: 'horizontal',
align: 'center',
verticalAlign: 'bottom'
}
}
}]
}
});
</script>
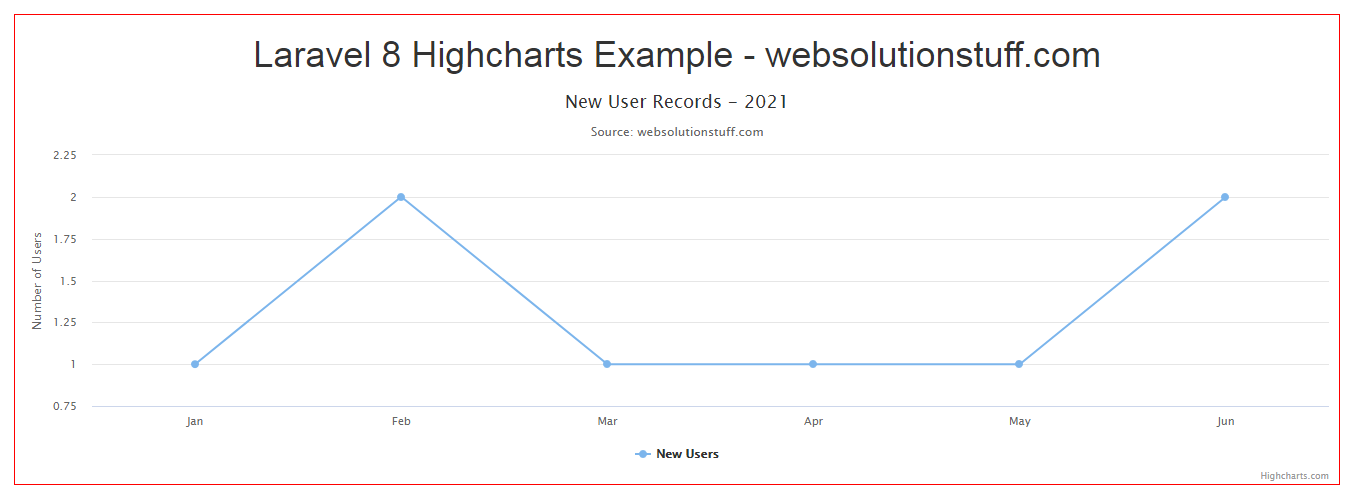
</html>after that you will get output like below scheenshot.